
Geographical Home Affordability Patterns in Ireland
- March 22, 2023

Introduction
Who can afford to buy their first home in the area where they currently live? How easy is it for couples to get on the ladder? Using income data derived from the CSO Geographic Profiles of Income in Ireland, the CSO County Incomes and Regional GDP Series, and the CSO Residential Property Price Index and through plotting and aggregating data from the Property Price Register, Gamma’s Location Labs have examined the affordability of Irish housing to the average household by area.
To estimate affordability by area, some assumptions are made. We assume that the household purchasing only has the minimum deposit amount either saved or released through sale of existing property. This would typify a first time buyer or mover with low equity in their current home. The standard mortgage limit is 80% of property value and up to 3.5 times applicant’s annual income.
Based on this assumption, we compare the property price affordable by the median household in each area with the actual sales price of the homes sold there between 2019 and 2021.
In 2016, the median household income in Ireland was €45,256. Adjusting for inflation to 2020 (the latest year for which income data is available), the equivalent median household income is approximately €55,000. This median household could then apply for a mortgage of €192,500 and, provided that they are also able to put down a deposit of €48,000, could purchase a home worth €240,500.
Analysing the property price register, we find that the median price of all private residential sales (which includes both first-time buyers and movers) between 2019 and 2021 was €255,500, which is a little above the theoretical €240,500.
Analysis at County Level
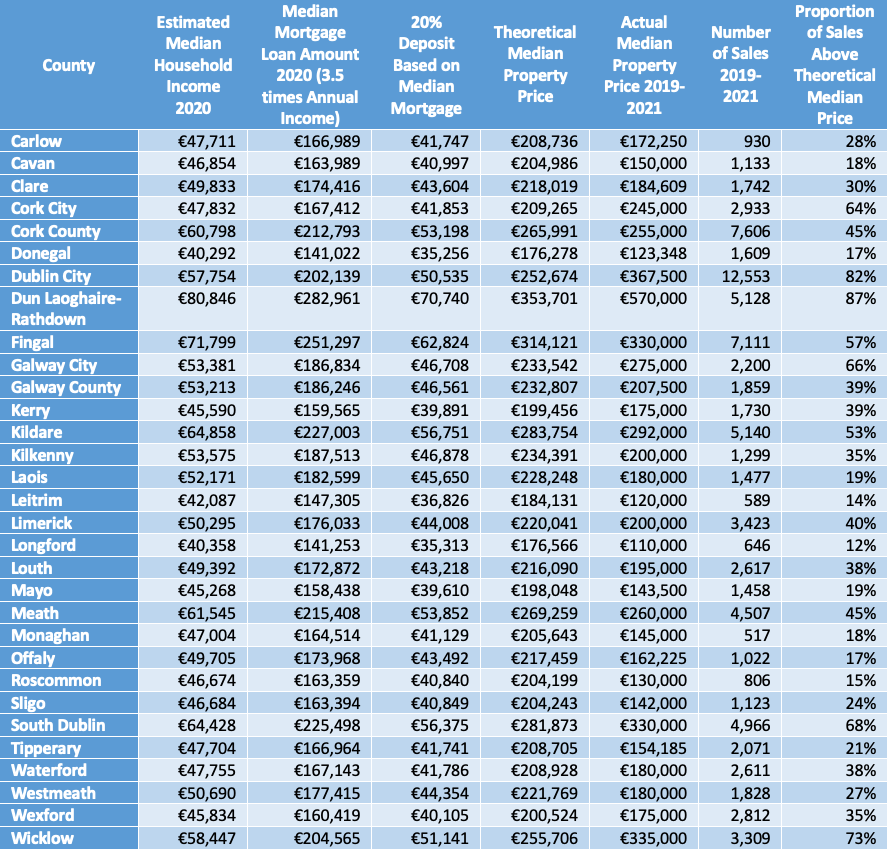
Household income and property values both vary across the country, the latter by a greater amount than the former. When we compare the median theoretical affordable property price with the median actual property price across all counties, some interesting patterns emerge.
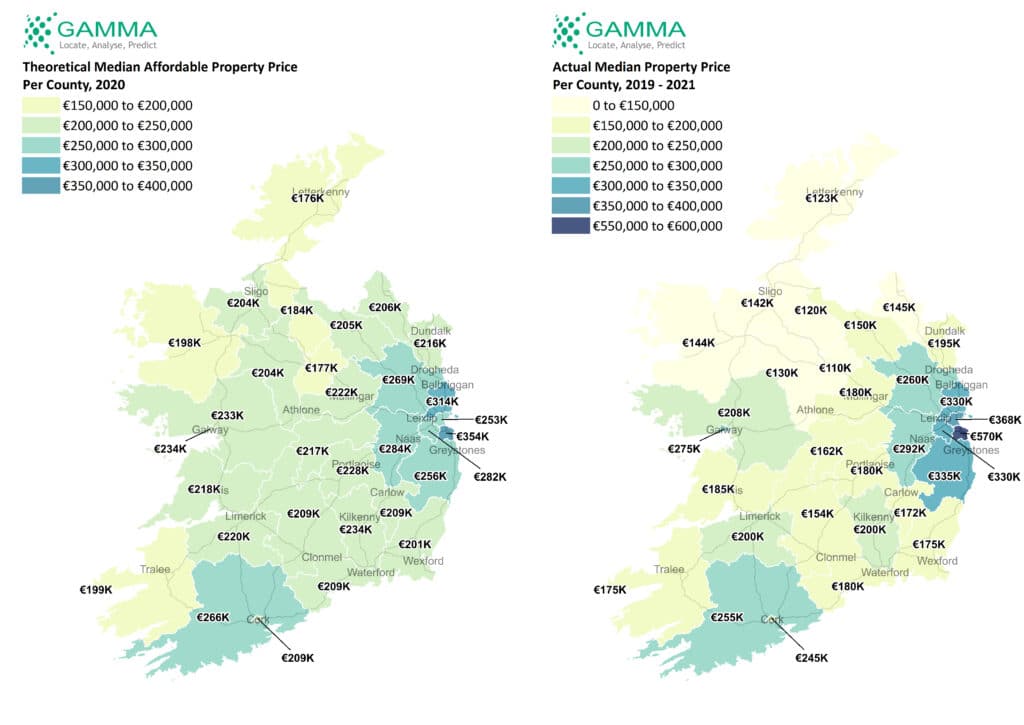
Maps 1&2 – showing theoretical median affordable property price per county in 2020 and the actual median property price per county in 2019-2021
The county-to-county variation in property prices is more extreme than the variation in income. The median household in Dun Laoghaire-Rathdown could qualify for a mortgage for twice as much as the median Longford household, but the median home there costs more than 5 times as much as the median Longford home!
In each county, some homes will have sold for more than the theoretical median affordable price and some for less. Using data from 2019-21, we can compare the actual sales prices in each county with the maximum affordable mortgage for a typical household.
Through this comparison, we can examine what proportion of homes for sale over the three-year period were affordable to the median income household. The results are shown in Map 3.

Map 3 – showing the proportion of homes sold 2019 to 2021 for a price unaffordable to the median household in each county in 2020
In many parts of the country, the majority of homes sold in 2019-2021 were for an amount within the mortgage that the median household in their county would have been approved for. However, this is not the case in the Greater Dublin Area and in Cork and Galway cities. In Dun Laoghaire-Rathdown, the median household would qualify for a mortgage of €283,000 and provided that they could put down a deposit of €71,000 could buy a home for €354,000. But 87% of homes in Dun Laoghaire-Rathdown sold for more than this amount, leaving only 13% of homes sold affordable to 50% of households (without other means).
Analysis at ED level
In 2017, the CSO reported the median household income for each of Ireland’s 3,409 Electoral Divisions (ED’s). We can use this data to estimate median 2020 household income per ED. This allows us to flag each sale in the property price register as being above or below the theoretical median property price in its ED. This allows for very fine-grained analysis as we can focus on any area and count the proportion of homes that sold for more than the median household’s theoretical mortgage. The patterns are shown in Map 4.
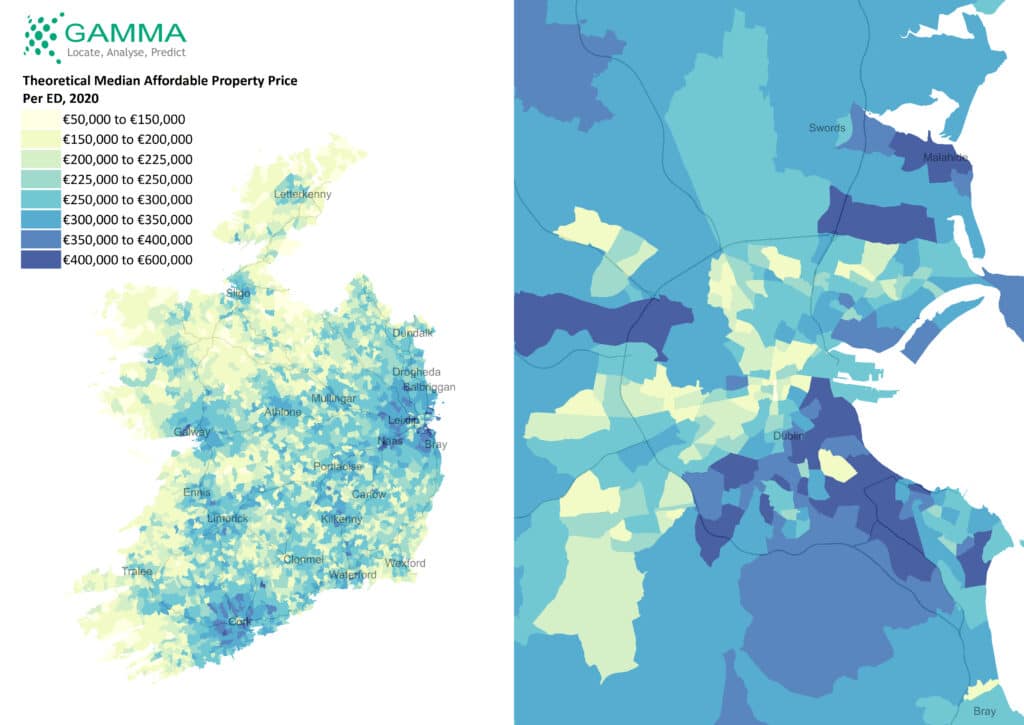
Map 4 – showing the theoretically affordable property price based on the median 2020 household income per ED
For example, 985 (92%) of the 1,071 sales in Dublin 5 were priced beyond the mortgage available to the median households in their ED. These were almost all west of Artane – and in Map 5, it is easy to see how the blue points cluster.
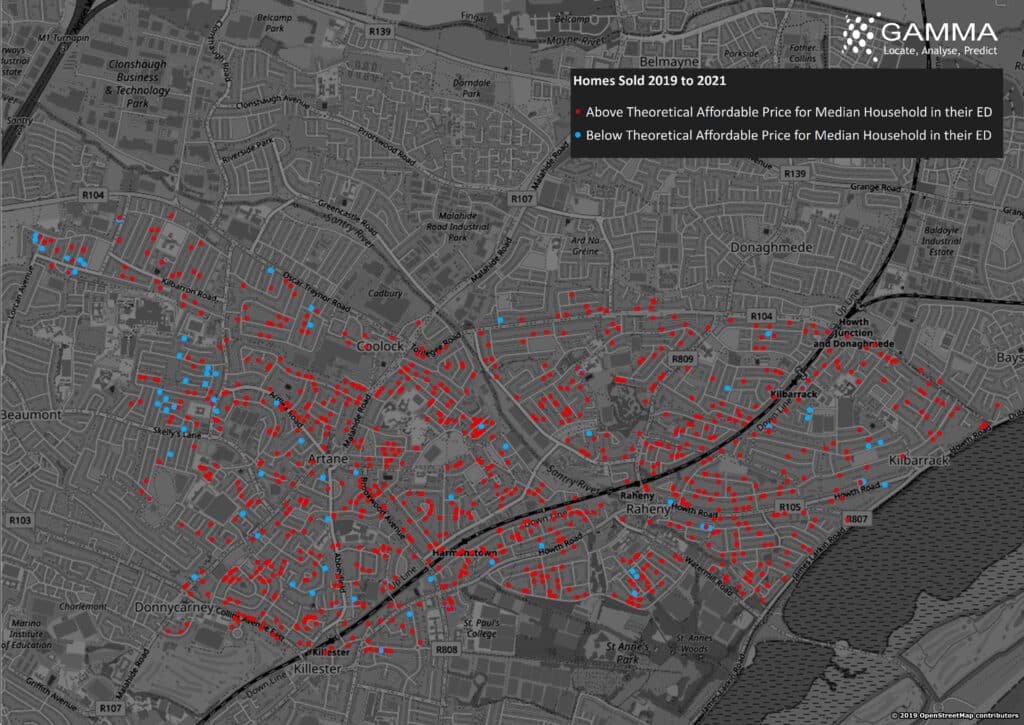
Map 5 – showing homes sold in D5 between 2019 and 2021, coloured by whether or not they would be affordable based on the median 2020 household income in their ED
Analysis at Eircode Routing Key Level
Ireland is divided into 140 routing key areas. These give the first three letters/numbers of your Eircode and are an appropriate size for areal analysis. In each routing key area, we can count how many homes in 2019-2021 were priced beyond the means of the median household in their ED. The results are plotted in Map 6.
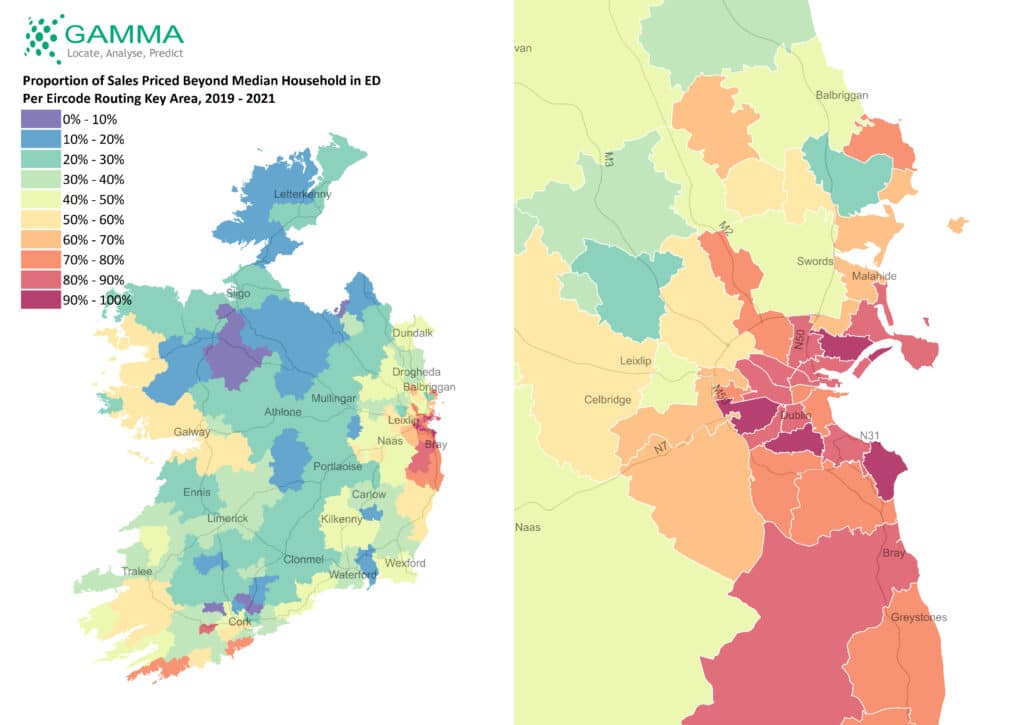
Map 6 – showing the proportion of homes sold between 2019 and 2021 that would be unaffordable based on the median 2020 household income in their ED, per Eircode routing key
This is particularly interesting because it allows us to compare to another recent publication – the CSO’s residential property price index, which gives the year-on-year change in mean and median property prices for each Eircode routing key, as shown in Map 7. Overall, the median home in Ireland cost 17% more in 2022 than 2020, but there is considerable variation around the country. In some places, the median property price has remained stable or even decreased, while other areas have seen increases of more than 70%.
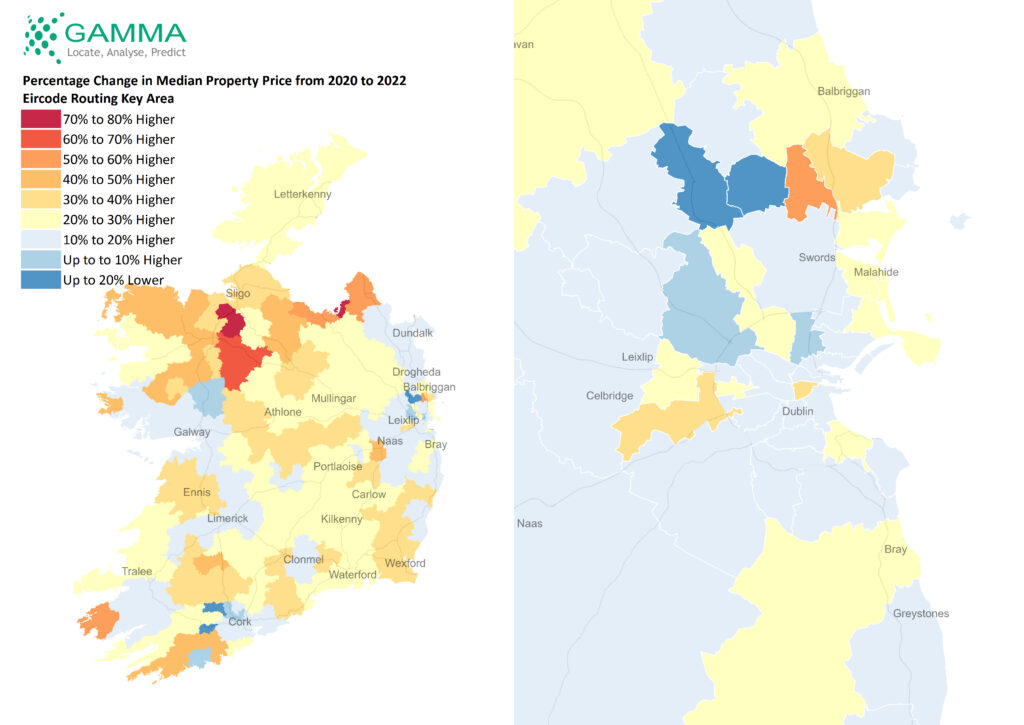
Map 7 – showing the percentage change in median home price per Eircode routing key area between 2020 and 2022
The good...
In Ashbourne (Eircode Routing Area A84), property prices in 2019 – 2021 were not out of synch with incomes – 60% of homes went for an amount that 50% of households in their ED could get a mortgage for. And in 2022, the median property price was 11% lower than in 2020!
The bad...
In Skibbereen (Eircode Routing Area P81), 72% of the 189 homes bought between 2019 and 2021 were priced out of reach of the median household, and the median property price in 2022 was 40% higher than in 2020. In Dublin 2 a similar situation was observed – 72% of the 324 homes sold between 2019 and 2021 were too expensive for the median household in their ED, and since 2020 the median property price has increased by 38%. That is, these two areas were already unaffordable to most of their own residents and are significantly more expensive now.
And the surprisingly neutral!
In Blarney and Dublin 15, there was a good alignment of property prices and household incomes, with 49% of sales in the former and 52% of sales in the latter being priced beyond the median household in their ED. What’s more, prices in these two areas have remained stable with only 2% and 3% increase in median property price between 2020 and 2022.
Individuals vs Households
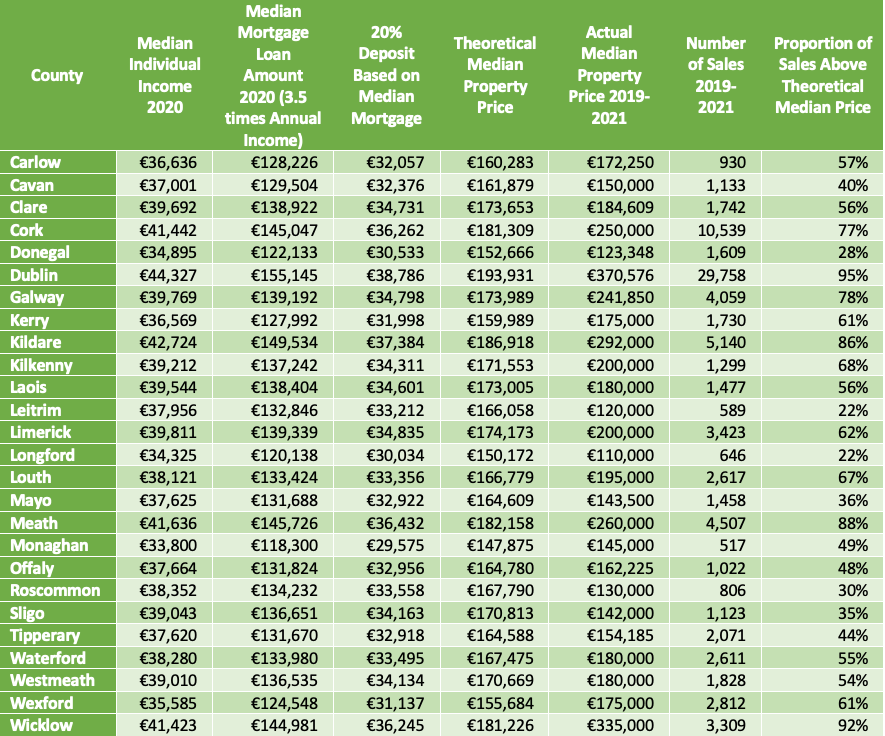
Not every prospective home buyer is in a position to pool resources with another earner. Can a single person realistically expect to own their own home in their own area?
In 2020, the median individual earned €40,579 and thus would qualify for a mortgage of €142,000. Provided that they can put down a deposit of €35,500, this would allow them to purchase a home for €177,500. Between 2019 and 2021, only about a quarter of home sales nationally were for less than this amount, so there is clearly more pressure on single people than couples when it comes to home ownership. But this also varies around the country – more than 90% of homes in Longford and Leitrim cost less than €177,500, compared to less than 15% of homes in Dublin and Wicklow.
Just as household income varies by county, so too does individual income. As before, we can apply the standard lending rule of 3.5 times annual income to calculate the mortgage an individual could qualify for in each county. Map 8 shows this pattern by county.

Map 8 – showing the proportion of homes sold 2019 to 2021 for a price unaffordable to the median individual in each county in 2020
In much of the country, the majority of homes for sale are priced beyond the means of the median individual. This may mean that single people are effectively trapped with the choice of long-term renting, or potentially moving away from their communities if they want to own a home.
@ 2023 Gamma.ie by Charlotte Cuffe
About Gamma
Gamma Location Labs is a cloud hosted spatial solutions provider that integrates software, data and services to help our clients reduce risk through location intelligence consultancy and software. Established in Dublin, Ireland in 1993, and with offices in Manchester, UK and Bilbao, Spain, the company has expanded to become a global provider of innovative, cloud-hosted location intelligence solutions.
Notes on Analysis
1 – Definition of Median
– The median household income means that half of households have income less than this amount and half have more.
– The median individual income means that half of individuals earn more than this amount and half earn less.
– The median property price means that half of the sales of homes between 2019 and 2021 were for less than this amount and half cost more.
2 – Components of Property Price
These maps show the median household income per county, and the corresponding mortgage amount of 3.5 times annual household income.


The typical mortgage is for 80% of the property value; thus the household needs to put down a 20% deposit. The mortgage plus the deposit gives the theoretical median affordable property price per county.
3 – Table of Counties
4 – Sources
- Median household income 2016 is sourced from the CSO publication Geographic Profiles of Income in Ireland
- Individual income 2020 and change in household income from 2016 to 2020 is estimated from the CSO County Incomes and Regional GDP Series
- Property prices 2019 – 2021 are taken from the Property Price Register after screening out multi-unit and non-private sales
- Property price changes from 2020 to 2022 are taken from the CSO Residential Property Price Index